
How to debug Silverlight application with only XAP file?
Posted on: 2011-10-15
Sometime, when the application is deployed to IIS server you may still need to do some debugging. Debugging a Silverlight application is in fact very easy, and pretty much the same when you are working inside Visual Studio but change when you need to debug it on the server.
The first step is to be sure that you .xap file deployed on IIS is the same as the one that you have in your developer environment. This can be automated when a Post-Build condition like this:
copy $(TargetDir)YOURxapFILEname.xap c:\\wwwroot\\mywebsite\\ClientBin\\YOURxapFILEname.xap
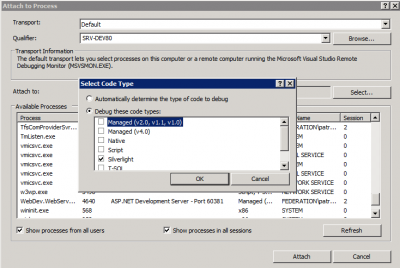
The second step is to go in Debug menu of Visual Studio and choose Attach To Process. This is a step that you would have to do to debug ASP pages. But, this will require a modification. When debugging .Net code, you usually set your debugging type to Managed. In the case of Silverlight, you must select Silverlight. This will automatically popup you a message saying that you cannot continue to debug in Managed. Just accept.
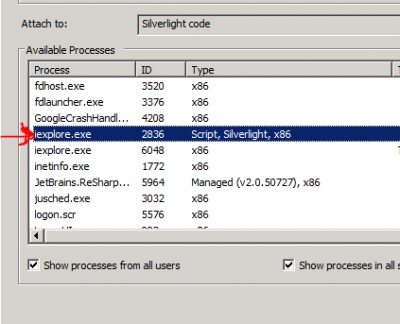
The third step is to attach to the process. This also require a modification. When debugging a ASP page you usually select W3WP.exe (the IIS application pool). This time, you need to attack to your browser. This can be Internet Explorer, Firefox or Chrome. The reason is that Silverlight is not server side but client side.
From there you just need to refresh your page and the breakpoint you have set will be trig once reached.