
Improving Visual Studio and MsBuild Speed for Large Solution
Posted on: 2016-04-13
I am working on a side project that is a single solution with 51 projects. The amount of project is considered "big" for 2016 while it was still considered "medium" few years ago. For some reason, Visual Studio doesn't handles very well project with more than 50 projects. I could refactor the solution by consolidating some projects and having a single project for unit testing instead of 12. Nevertheless, this take some time and before optimizing the design of the solution, let's start by understand what is happening.
First, we need some basic metric. One useful extension to add in Visual Studio is the Build Monitor Extension by Daniel Vinntreus. This will give you an additional Output with the time of each project to be compiled. The second tool is also free, it is called Process Monitor. This can be download from Microsoft TechNet website. This tool lets you see what the process write on the hard drive (and more). Here was the data from both of these tool.
00h 00m 01s 253ms -- MySqlToMsSql
00h 00m 03s 898ms -- ModelContracts
00h 00m 04s 277ms -- ComplexTypes
00h 00m 04s 901ms -- CrossLayer
00h 00m 00s 871ms -- TestHelpers
00h 00m 01s 139ms -- ComplexTypesUnitTest
00h 00m 01s 248ms -- ValueObjects
00h 00m 03s 053ms -- CrossLayerUnitTest
00h 00m 01s 481ms -- ComplexTypesWithValueObjects
00h 00m 03s 586ms -- ComplexTypesWithValueObjectsUnitTest
00h 00m 05s 555ms -- ValueObjectsUnitTest
00h 00m 05s 747ms -- Model
00h 00m 01s 884ms -- ModelBuilders
00h 00m 10s 744ms -- ModelUnitTest
00h 00m 12s 927ms -- ViewModel
00h 00m 12s 527ms -- ModelBuildersTest
00h 00m 03s 407ms -- Mapping
00h 00m 14s 751ms -- DataAccess
00h 00m 03s 980ms -- ViewModelBuilders
00h 00m 10s 642ms -- MappingUnitTest
00h 00m 10s 708ms -- ViewModelUnitTest
00h 00m 11s 235ms -- Services
00h 00m 12s 411ms -- WebServicesCore
00h 00m 25s 328ms -- DataAccessMigration
00h 00m 25s 943ms -- DataAccessUnitTest
00h 00m 03s 291ms -- ScriptCleanExpiredOrders
00h 00m 16s 434ms -- ServicesIntegrationTest
00h 00m 18s 438ms -- ServicesUnitTest
00h 00m 20s 570ms -- IoC
00h 00m 08s 155ms -- ScriptDailyPerformance
00h 00m 05s 538ms -- ScriptBuyOrders
00h 00m 08s 966ms -- ScriptInitializeCache
00h 00m 08s 522ms -- ScriptEndContests
00h 00m 09s 063ms -- ScriptIndiceMarketPoint
00h 00m 15s 038ms -- ScriptBotRegisterContest
00h 00m 15s 665ms -- ScriptSymbolChange
00h 00m 12s 100ms -- ScriptFindUpcomingSplit
00h 00m 12s 101ms -- ScriptFindUpcomingSymbolRename
00h 00m 12s 011ms -- ScriptBotBuyContest
00h 00m 12s 070ms -- ScriptBuyShortOrders
00h 00m 14s 895ms -- ScriptEndOfDayBadges
00h 00m 21s 934ms -- FrontEndSharingLayer
00h 00m 12s 243ms -- ScriptUpdateCompanyInformation
00h 00m 23s 498ms -- ScriptSellShortOrders
00h 00m 23s 583ms -- ScriptSellOrders
00h 00m 34s 100ms -- ScriptSymbolSplit
00h 00m 34s 153ms -- ScriptInterdayStatisticPortefolios
00h 00m 30s 416ms -- DataAccessIntegrationTest
00h 00m 29s 488ms -- WebSite
00h 00m 08s 063ms -- Architectures
00h 00m 08s 267ms -- WebSiteUnitTest -- Time Elapsed: 00h 02m 51s 635ms
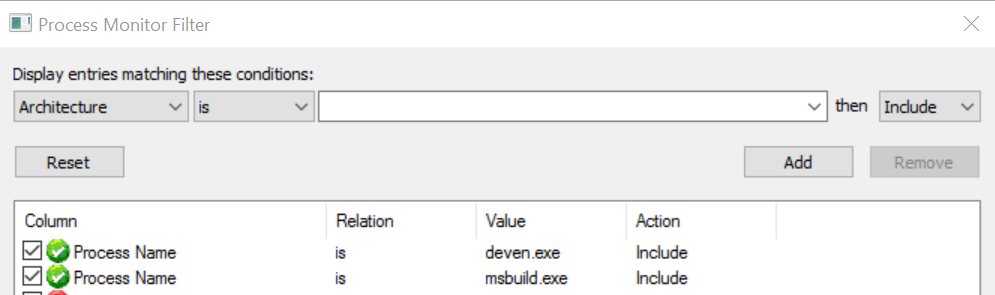
To get these statistics, I first clean up the solution to have the build rebuild everything. The total amount of time is 2 minutes 51 seconds. A lot of time is one project starting with "Script" which are webjob that run in the background. These ones are in Visual Studio under a folder and could be disabled in the future. This is something I was not doing and thus wasting a lot of build time when working on the main project : the website. Process Monitor is also educational by showing how many bytes is written when building the solution. To do so, open Process Monitor, click Filter (Ctrl+L) and add Visual Studio process (Devenv.exe) and MsBuild (msbuild.exe).
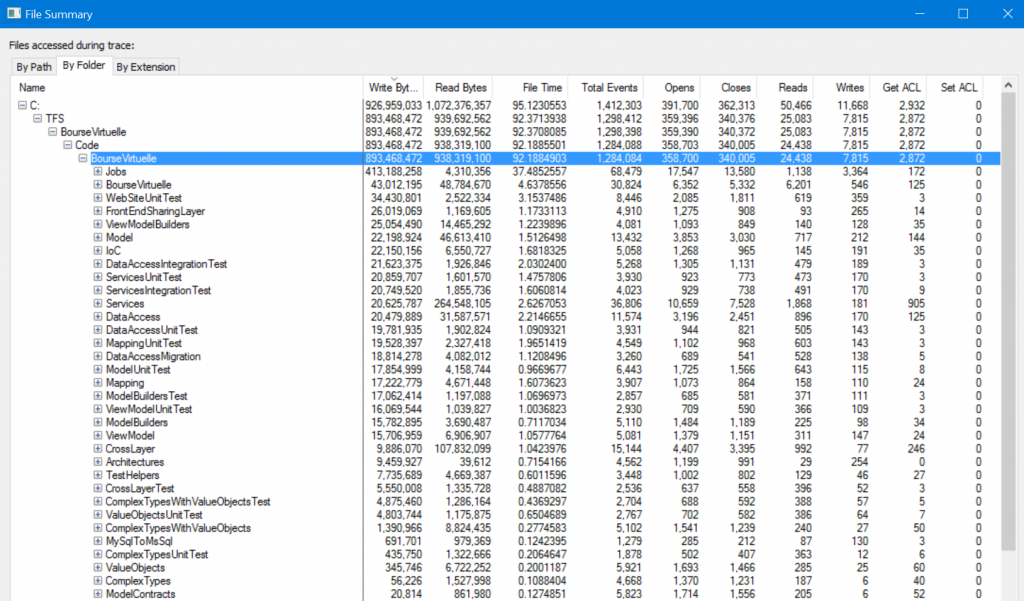
This give us 893 megs written. I am on a SSD drive so it still not bad, but to be honest quite a lot of writing. From here, I noticed few things. First, I have a lot of bin folder with the same files. Second, that we are rebuilding the same file because they referenced them. To improve, I decided to edit all projects to output on the same bin folder. Third, the jobs folder that contains all scripts are heavy on the writing.
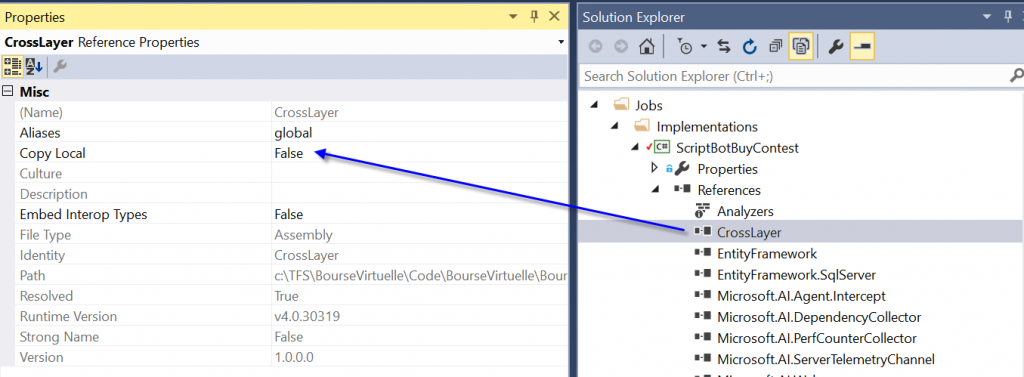
I decided to have every project to output in the bin folder of the website. The reason is that I have IIS taking the bin folder as source so every time I build I can just refresh the browser to get the website with the latest version without deploying. After that, I went into all projects references and click reference to other projects and changing the Copy Local to false.
From there, I cleaned up everything (all bin folder empty) and re-build everything to see how the performance improved. First, the Build Monitor extension is showing some improvements:
00h 00m 00s 505ms -- ComplexTypes
00h 00m 00s 601ms -- ModelContracts
00h 00m 00s 352ms -- ComplexTypesUnitTest
00h 00m 01s 453ms -- MySqlToMsSql
00h 00m 01s 383ms -- ValueObjects
00h 00m 03s 002ms -- CrossLayer
00h 00m 01s 402ms -- ComplexTypesWithValueObjects
00h 00m 01s 488ms -- CrossLayerUnitTest
00h 00m 01s 940ms -- TestHelpers
00h 00m 02s 924ms -- Model
00h 00m 01s 637ms -- ValueObjectsUnitTest
00h 00m 01s 806ms -- ComplexTypesWithValueObjectsUnitTest
00h 00m 01s 184ms -- ModelBuilders
00h 00m 03s 282ms -- ViewModel
00h 00m 05s 198ms -- ModelUnitTest
00h 00m 02s 993ms -- Mapping
00h 00m 05s 746ms -- ModelBuildersTest
00h 00m 03s 516ms -- ViewModelBuilders
00h 00m 06s 564ms -- DataAccess
00h 00m 00s 788ms -- ViewModelUnitTest
00h 00m 03s 636ms -- MappingUnitTest
00h 00m 03s 634ms -- Services
00h 00m 04s 583ms -- DataAccessMigration
00h 00m 04s 983ms -- DataAccessUnitTest
00h 00m 04s 610ms -- ServicesIntegrationTest
00h 00m 06s 222ms -- IoC
00h 00m 06s 657ms -- WebServicesCore
00h 00m 11s 568ms -- ServicesUnitTest
00h 00m 04s 573ms -- ScriptIndiceMarketPoint
00h 00m 06s 860ms -- DataAccessIntegrationTest
00h 00m 04s 658ms -- ScriptCleanExpiredOrders
00h 00m 04s 715ms -- ScriptEndContests
00h 00m 05s 408ms -- ScriptInitializeCache
00h 00m 05s 637ms -- ScriptDailyPerformance
00h 00m 01s 181ms -- ScriptBuyOrders
00h 00m 01s 760ms -- ScriptSymbolChange
00h 00m 01s 831ms -- ScriptBotRegisterContest
00h 00m 01s 770ms -- ScriptFindUpcomingSplit
00h 00m 01s 766ms -- ScriptFindUpcomingSymbolRename
00h 00m 07s 225ms -- FrontEndSharingLayer
00h 00m 09s 518ms -- ScriptEndOfDayBadges
00h 00m 09s 531ms -- ScriptBuyShortOrders
00h 00m 09s 540ms -- ScriptBotBuyContest
00h 00m 08s 867ms -- ScriptUpdateCompanyInformation
00h 00m 11s 291ms -- ScriptSymbolSplit
00h 00m 11s 304ms -- ScriptSellShortOrders
00h 00m 10s 675ms -- ScriptSellOrders
00h 00m 02s 717ms -- ScriptInterdayStatisticPortefolios
00h 00m 10s 860ms -- WebSite
00h 00m 03s 206ms -- WebSiteUnitTest
00h 00m 03s 952ms -- Architectures -- Time Elapsed: 00h 01m 32s 275ms
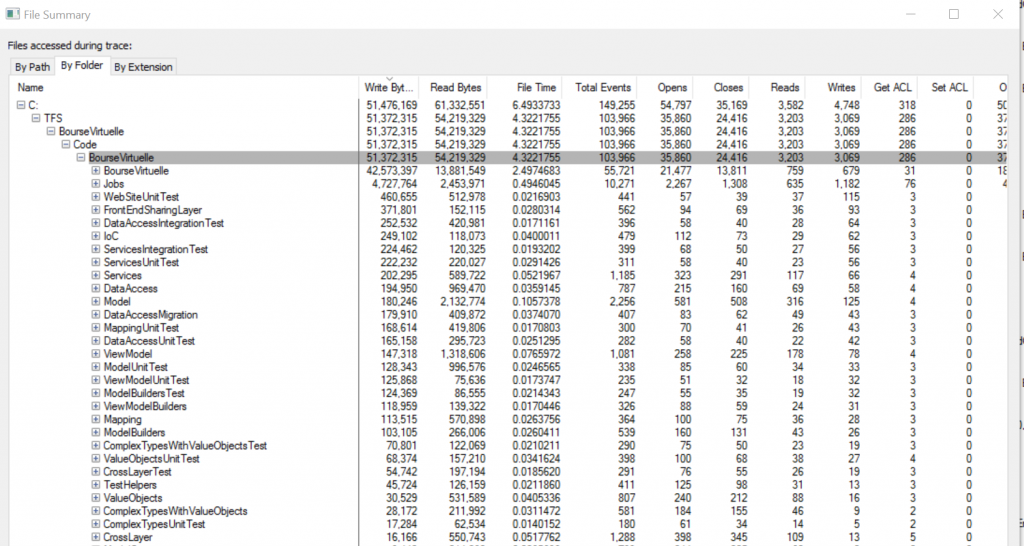
The time to build is cut by half. This is already better. If we take the Process Monitor we can see the reason: we write only 51 megs.
Finally, if I unload all jobs project (scripts) one, I have a build time of 1m13sec. Not a huge improvement, but still 20 seconds less! The initial performance of 2 minutes 51 seconds to 1 minute 13 secconds is quite appreciable. With all these changes some problems raised. First, when pushing the code in the continuous integration (ci) environment, the build server is not able to build the whole solution. This is because the build server builds the startup project which doesn't copy local any references. The second problem is when you deploy. Visual Studio Publish mechanism build the main project too, whence the same consequences. So, we need to add additional steps to build everything and we will come back to have some performance lost.
An other direction is to remove the most possible projects. This approach is fine but limited to what you can group together. For example, I have 1 web project, and about 14 web jobs. This mean a minimum of 15 projects. If we want to divide unit tests from the code, we can add 1 more project. If we want to share webjobs and website logic we add one more project. Still, we have half the number of project and while working on the shared tier and website, it is always possible to unload from the main solution every webjob projects. The best way to move everything is to create a shared project, that I called "ApplicationTier". The website project remains the same but refers this new project. Inside Visual Studio, we need to go one by one in each project to drag-and-drop all files in a folder with the same name of the project. The final result is easy to read and consolidate a lot of project within one but with familiar structure. At the end, the result was very impressive. Instead of taking 2 minutes 51 seconds the build time was at 54 seconds.
00h 00m 00s 775ms -- MySqlToMsSql
00h 00m 06s 799ms -- ApplicationTier
00h 00m 06s 064ms -- DataAccessMigration
00h 00m 03s 400ms -- ApplicationTierUnitTest
00h 00m 09s 714ms -- WebServicesCore
00h 00m 11s 656ms -- WebSite
00h 00m 02s 612ms -- ScriptCleanExpiredOrders
00h 00m 02s 312ms -- ScriptFindUpcomingSymbolRename
00h 00m 05s 217ms -- ScriptEndContests
00h 00m 05s 271ms -- ScriptBuyShortOrders
00h 00m 05s 345ms -- ScriptBuyOrders
00h 00m 03s 508ms -- ScriptFindUpcomingSplit
00h 00m 07s 308ms -- ScriptDailyPerformance
00h 00m 08s 350ms -- ScriptSymbolChange
00h 00m 08s 447ms -- ScriptBotRegisterContest
00h 00m 03s 731ms -- ScriptEndOfDayBadges
00h 00m 03s 327ms -- ScriptSymbolSplit
00h 00m 04s 775ms -- ScriptBotBuyContest
00h 00m 04s 728ms -- ScriptUpdateCompanyInformation
00h 00m 02s 835ms -- ScriptSellOrders
00h 00m 02s 907ms -- ScriptSellShortOrders
00h 00m 01s 714ms -- ScriptInterdayStatisticPortefolios
00h 00m 01s 608ms -- ScriptInitializeCache
00h 00m 01s 579ms -- ScriptIndiceMarketPoint
00h 00m 04s 239ms -- Architectures
00h 00m 05s 405ms -- WebSiteUnitTest -- [3] Time Elapsed: 00h 00m 54s 059ms
By reducing the amount of project, we have a lot less references that needs to be cut. The number of megs written on disk is about 550 megs now. The main bottle neck is all the scripts for webjobs. Since all jobs are just entry points to the ApplicationTier, if they share the same bin folder, it will reduce by a lot the building time. This is because that the first script project to build will get the binary files in the bin folder, and subsequent scripts will just build the executable project without building again the references. The result is the following 31 seconds, mainly because only 196 megs go written on the disk.
00h 00m 01s 633ms -- MySqlToMsSql
00h 00m 06s 483ms -- ApplicationTier
00h 00m 06s 696ms -- DataAccessMigration
00h 00m 01s 458ms -- ApplicationTierUnitTest
00h 00m 08s 610ms -- WebServicesCore
00h 00m 09s 298ms -- WebSite
00h 00m 01s 044ms -- ScriptCleanExpiredOrders
00h 00m 00s 719ms -- ScriptFindUpcomingSymbolRename
00h 00m 01s 140ms -- ScriptFindUpcomingSplit
00h 00m 02s 132ms -- ScriptDailyPerformance
00h 00m 02s 282ms -- ScriptBuyOrders
00h 00m 02s 216ms -- ScriptBotRegisterContest
00h 00m 02s 477ms -- ScriptBuyShortOrders
00h 00m 02s 295ms -- ScriptSymbolChange
00h 00m 00s 771ms -- ScriptEndOfDayBadges
00h 00m 02s 619ms -- ScriptEndContests
00h 00m 00s 811ms -- ScriptUpdateCompanyInformation
00h 00m 00s 858ms -- ScriptBotBuyContest
00h 00m 00s 764ms -- ScriptSymbolSplit
00h 00m 03s 963ms -- ScriptSellShortOrders
00h 00m 04s 022ms -- ScriptSellOrders
00h 00m 03s 957ms -- ScriptInitializeCache
00h 00m 04s 030ms -- ScriptInterdayStatisticPortefolios
00h 00m 03s 683ms -- ScriptIndiceMarketPoint
00h 00m 04s 649ms -- WebSiteUnitTest
00h 00m 01s 533ms -- Architectures -- Time Elapsed: 00h 00m 31s 471ms
I quickly started the RamDisk tool to see if having the scripts bin folder could benefit of it and I haven't see any improvement. Finally, I am pretty happy of the end result. I can always unload all scripts and this can be done easily since they are inside a folder. Inside Visual Studio, right click the folder that contain these folders and click "unload project". This will unload all of them in 1 operation. For further optimization, we could also unload the migration project and unit tests and by doing so having less than 20 seconds of total build time.