
Application Insight Analytics Feature
Posted on:
If you are using Microsoft Azure Application Insight to send telemetry you may had yourself a little bit in a corner when it was the time to consume the data. Microsoft Azure portal has a metric explorer, but it was limited on what you can group on and custom properties were hard to queries. In fact, I should say that it wasn't possible to really query other than using pre-defined option. Recently, the Application Insight team released Analytics service.
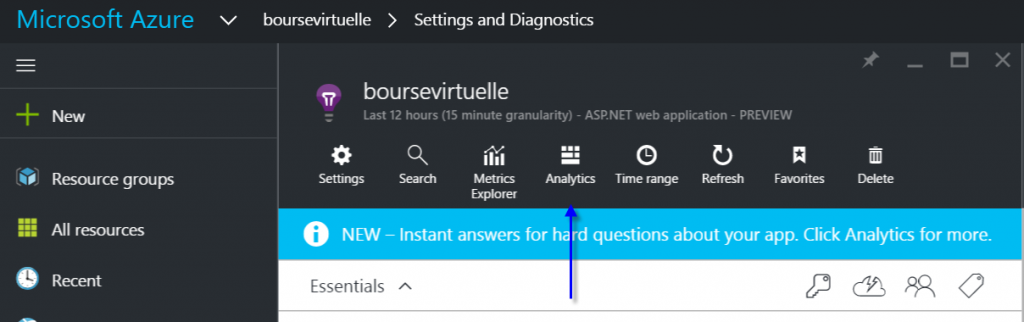
The Analytics service is available directly on Microsoft Azure portal. The Analytics is on its on page -- you won't be on Azure portal anymore. The website is very well done. You will see an easy access to the documentation, on the left side of the page is some commands you can use and in the main part you have a huge textbox where you will write you queries. The Analytics service is a query tool to get information from Application Insights. You can create queries, save them, generate tables of data or graphics all in this webpage.
For example, I have some Azure WebJobs that collect the duration of the jobs. The output desired is to see the time that a job take and if the performance are stable across every execution but also in every day. This is possible with Analytics. The syntax is not really easy to catch on and I won't give all information in this article.
customEvents
| where name == "JobPerformance"
| where timestamp >= ago(14d)
| extend d=parsejson(customDimensions)
| extend jobName = d.JobName
| where jobName == "CleanExpiredOrders"
| extend m=parsejson(customMeasurements)
| extend tt = todouble(m.JobElapsedTimeInMs)
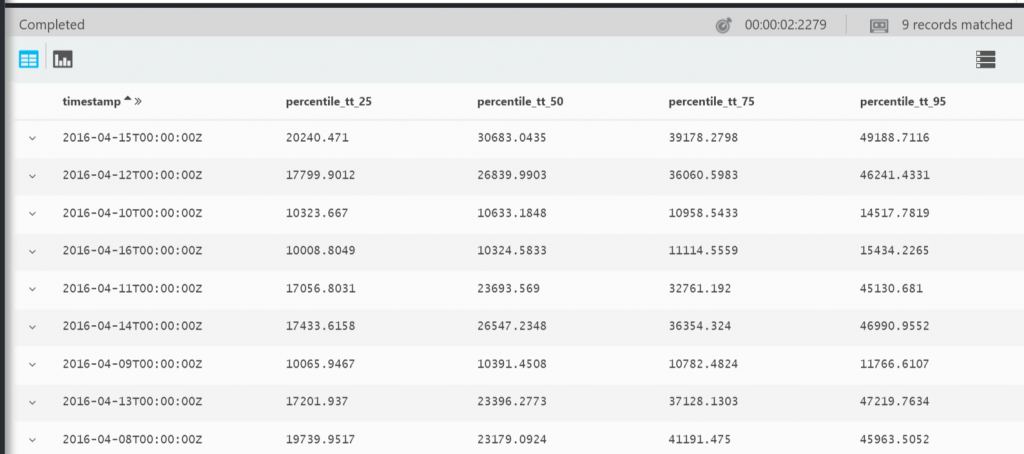
| summarize percentiles(tt, 25, 50, 75, 95) by bin(timestamp,1d)
The first line is about on "what" we will query. I have create a custom query with the name "JobPerformance" that I use to run on each type of WebJob I have. The second line filter down to that telemetry -- only WebJob. The third line filter even more to get just the last 14 days. The two next lines open the customDimensions which are properties that you create during the write of the telemetry. In my case, this is an object with some properties, the one I need it the JobName. I need it because I want a graph in time for a specific job named "CleanExpiredOrders". Finally, I need to get from that custom event some custom measurements. I need the property I created named "JobElapsedTimeInMs". Once all information is collected, the idea is to bucket the data in percentile to see if we have some stable performances across queries. This is done by summarizing with the percentiles keyword. Since we want to get the information per day, we select a bin per day.
This gives in few seconds a table with all the data.
Even more useful we can graph the output:
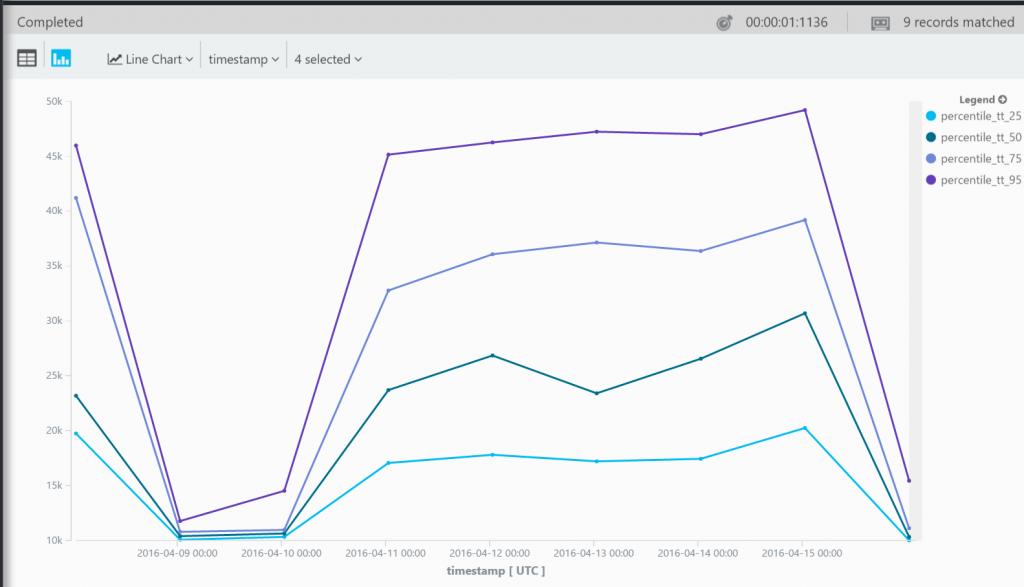
Microsoft Application Insight has just got a new boost with the Analytics page. It's now possible to query the way you want your data but also your custom data in whatever the structure you decided to save them.