
How to communicate from your website to a Chrome Extension
Posted on:
Passing a message from a website to a Chrome Extension is not routine job. Not only the communication between a specific piece of code from the browser to a specific browser is unusual, it is also confusing by the potential type of extension. In this article, I'll focus on an extension that goes into the Chrome Extension Developer tools. Similar to the "Elements" or "Network" tab, the extension will have its own tab that will be populated by the website. To be more accurate, it could be any website using a specific library.
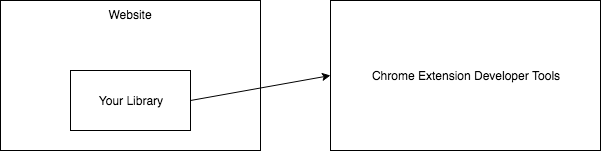
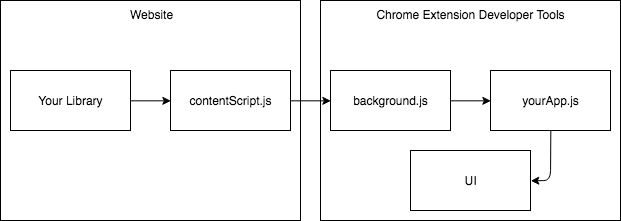
The illustration is the concept of what is happening. The reality is a little bit more complicated. There is more communication boundary that is required which can be confusing at first. The documentation is great but it lacks guidance for a first time user. The following illustration is what happens in term of communication and with that in mind, the flow should be easier to understand.
Your library that is sending information to your extension is very simple. It consists of using the "window.postMessage" to send an object. The extension will read and parse your payload depending on the source. For my library and extension, named Data Access Gateway, I decided to have the source name "dataaccessgateway-agent". The name could be anything. Keep in mind that later, you will reuse the name at the extension code to verify that the message is coming from your source.
window.postMessage({ source: "dataaccessgateway-agent", payload: requestInfo }, "*");
The payload may be anything you want but make sure it remains with an object that is not constructed (with "new). For example, if in your payload you have a date, make sure they are not in the payload as an actual Date object but in a more primitive form (string or number). Otherwise, you will receive an exception.
The next step is to configure the manifest file for the extension. The critical detail is to specify two JavaScript files: the background and content_script. The former run regardless of which website is active. It runs in the background of the Chrome Extension from when the extension is loaded until it is unloaded. The latter is a script that the extension injects into the webpage. The injection can be targetted to a specific page or to run on all webpage. In my case, the extension must receive a message from a library, hence I do not know which website might use it and I allow the injection in every page. Because we are having this requirement to be available on every page, the security and the communication is more overwhelming that most information you can find in the basic documentation.
{
  "name": "Data Access Gateway Developer Tool",
  "version": "1.0",
  "description": "Data Access Gateway Developer Tool that allows getting insight about how the data is retrieved",
  "manifest_version": 2,
  "permissions": [ "storage", "http://*/*", "https://*/*", "<all_urls>" ],
  "background": {
    "scripts": [ "background.js" ],
    "persistent": false },
    "icons": { "16": "images/dagdl16.png", "32": "images/dagdl32.png", },
    "minimum_chrome_version": "50.0",
    "devtools_page": "index.html",
    "content_security_policy": "script-src 'self' 'unsafe-eval'; object-src 'self'",
    "content_scripts": [
      {
        "matches": [ "<all_urls>" ],
        "js": [ "contentScript.js" ],
        "run_at": "document_start"
      }
    ]
  }
The manifest file asks for permissions and specifies the "index.html" which is the file loaded when the Chrome Developer Tool panel is open. We will come back later on the HTML file. The important part is the background and contentScript.js. Both files can be renamed as you wish. Before moving on, it is important to understand that the communication flows in this particular order: postMessage -> contentScript.js -> background.js -> dev tools HTML page. The core of the code will be in the HTML page and the remaining is just a recipe that must be followed to be compliant with Chrome's security.
The contentScript.js is the file injected into the webpage. The sole purpose of this file is to listen for message passed by "window.postMessage", to check the payload and make sure this is the one we are interested in and move along to Chrome's runtime. The following code registers a "message" listener when the webpage loads. The script captures "postMessage" and checks for the source. When is the agent name defined in the previous step, we invoke the sendMessage from the Chrome's runtime. The invocation passes the message to the background.js file.
window.addEventListener("message", (event) => { // Only accept messages from the same frame
  if (event.source !== window) {
    return;
  }

  var message = event.data;

  // Only accept messages that we know are ours
  if (typeof message !== "object" || message === null || !!message.source && message.source !== "dataaccessgateway-agent") {
    return;
  }
  chrome.runtime.sendMessage(message);
});
The next step is to listen to the Chrome's runtime messages. More code is required. There is a collection of tabs which will handle multiple tabs situation to know where it comes from. There are two listeners. One handle incoming new message and one for new Chrome's tab. The message dispatches the message to the proper tab, the other listener subscribes to and unsubscribe the tab.
let tabPorts: { [tabId: string]: chrome.runtime.Port } = {};
chrome.runtime.onMessage.addListener((message, sender) => {
  const port = sender.tab && sender.tab.id !== undefined && tabPorts[sender.tab.id];
  if (port) {
    port.postMessage(message);
  }
  return true;
});

chrome.runtime.onConnect.addListener((port: chrome.runtime.Port) => {
  let tabId: any;
  // chrome.runtime.onMessage.addListener
  port.onMessage.addListener(message => {
    if (message.name === "init")
    {
      // set in devtools.ts
      if (!tabId) {
        // this is a first message from devtools so let's set the tabId-port mapping
        tabId = message.tabId;
        tabPorts[tabId] = port;
      }
    }
  });
  port.onDisconnect.addListener(() => {
    delete tabPorts[tabId];
    });
});
The post.postMessage send the payload for the last time. This time, it will be within reach of your Chrome Developer Tools extension. You may remember that in the manifest file we also specified an HTML file. This file can have a JavaScript file specified that will listen to the messages from the background.js script. I am developing the Data Access Gateway Chrome Extension with React, so the index.html starts the index.jsx, this one attach the app.jsx which will have in its constructor the listener.
this.port = chrome.runtime.connect({ name: "panel" });

this.port.postMessage({ name: "init", tabId: chrome.devtools.inspectedWindow.tabId });

this.port.onMessage.addListener((message: Message) => {
  if (message.source === "dataaccessgateway-agent") {
    // Do what you want with the message object
    // E.g. this.setState(newState);
  }
});

chrome.devtools.panels.create( "Data Access Gateway", "images/dagdl32.png", "index.html" );
Still quite a few lines of code before actually doing something in the Chrome's extension. The first one is to connect to the tab (port). Then, initializing the communication by sending a post message. Finally, on the connected port to start listening to incoming messages. Finally, we invoke the creation of the panel. As you might have seen, the "addListener" is strongly typed with the object I sent from the initial library call -- that is right! TypeScript is supported in each of these steps. You can see all the detail, in TypeScript, in the GitHub Repository of the Data Access Gateway Chrome Extension.
To conclude, the transportation of your object from your library (or website) to the Chrome's Developer panel is not straightforward. It requires multiple steps which can fail in several places. A trick I learned while developing the extension is that "console.warn" is supported. You can trace and ensure that the data is passing as expected. Also, another debugging trick, you should undock the extension (to have the Developer Tool in a separate window) which will allow you to do "command+i" on Mac or "f12" on Windows to debug the Chrome's developer tool. This is the only way to not only see your tracing but to set a breakpoint in your code.