
How to investigate Azure Redis Timeout performance Error
Posted on: 2016-08-30
There is many official resource about how to troubleshoot Redis Azure cache and Azure Redis performance FAQ but I couldn't see what was problem. So, I'll try to give some of the steps I did to figure out my problem. My problem might not be like yours, but I didn't have any problem locally. Problems started to surge when I deployed in production on Azure. My setup was pretty basic with a Standard Web App (S1) and the smallest Azure Redis instance (C0). Even by upgrading to a Azure Redis instance (C1), which is quite more powerful I was still getting Redis timeout performing error.
Before continuing, I read that the C0 instance is just for testing purposed and not for production. The size is 4x bigger, this wasn't an issue for me but I realized that I was hitting the 250mb limit which was producing Redis to remove items from the cache. This wasn't a major problem in my case. The biggest change between C0 and C1 is the Megabytes per sec (MB/s) that go from 0.625 to 12.5megs. This is 24x faster. It also handle 12000 request per seconds which is 2x more than C0. In my case, I kept the update even if it didn't fixed the issue.
The second modification was to change the number of thread. By default, Redis uses the same amount of thread to the amount of processor that the web server is running. A S1 instance is single core, thus was running on a single thread to send request to Azure Redis. This is problematic because requests queues and time out. To change the amount of thread, you can set the value in your Global.asax.cs in the Application_Start method. The value is not clear in the documentation. From my reading, it should be under 100 threads before having some performance issues. I decided to go with 50 which is 50 times more than the default configuration.
ThreadPool.SetMinThreads(50, 50)
Since time out was the problem, I also changed my connection string to handle extend the time before timing out. I put something that is way bigger than the default value of 1 sec. I decided to put 15 seconds which I will probably set down in the future.
xxx.redis.cache.windows.net:6380,password=xxxx,ssl=True,abortConnect=False,connectRetry=5, connectTimeout=15000, synctimeout=15000
I was already using a Lazy loading ConnectionMultiplex as described in the official documentation. To be able to have parallel call while a connection is used, I created a pool of lazy loading ConnectionMultiplex and was cycling between them in a Round-Robin style.
The code looks like:
 //Fields in my Redis Cache class: private const int POOL_SIZE = 10; private static int connectionIndex = -1; //Because we ++ before using. The first time it will be 0. private static readonly Object lockPookRoundRobin = new Object(); private static readonly Lazy<ConnectionMultiplexer>[] lazyConnection;

private static ConnectionMultiplexer Connection { get { lock (lockPookRoundRobin) { connectionIndex++; if (connectionIndex >= POOL_SIZE) { connectionIndex = 0; } return lazyConnection[connectionIndex].Value; } } }

//Static constructor to be executed once on the first call static RedisCache() { lock (lockPookRoundRobin) { lazyConnection = new Lazy<ConnectionMultiplexer>[POOL_SIZE]; var connectionStringCache = System.Configuration.ConfigurationManager.AppSettings["CacheConnectionString"]; for (int i = 0; i < POOL_SIZE; i++) { lazyConnection[i] = new Lazy<ConnectionMultiplexer>(() => ConnectionMultiplexer.Connect(connectionStringCache)); } } }
I have several methods that use Connection which give the next connection to execute a call.
At this point, I was in a better situation but some small requests were still failing. By small I mean request that was returning few kilo bytes of data. At that point, I decided to look at the portal and realized that I was reaching almost the limit of 1 gig of Redis! I was quite surprise because with the production data I was reaching about 200 megs most of the time. This is where I learned the command --bigkeys of Redis. This command gives your some information about which keys is taking a lot of space. From my manual inspection, I knew that I had about hundreds of key that was reaching 700kbs to 2 megs. However, with that tool, I found dozen and dozen of entries around 18 megs. The command look likes this :
"D:\\Program Files\\Redis\\redis-cli.exe" -h xxxx.redis.cache.windows.net -p 6379 -a PASSWORDXXXXX --bigkeys
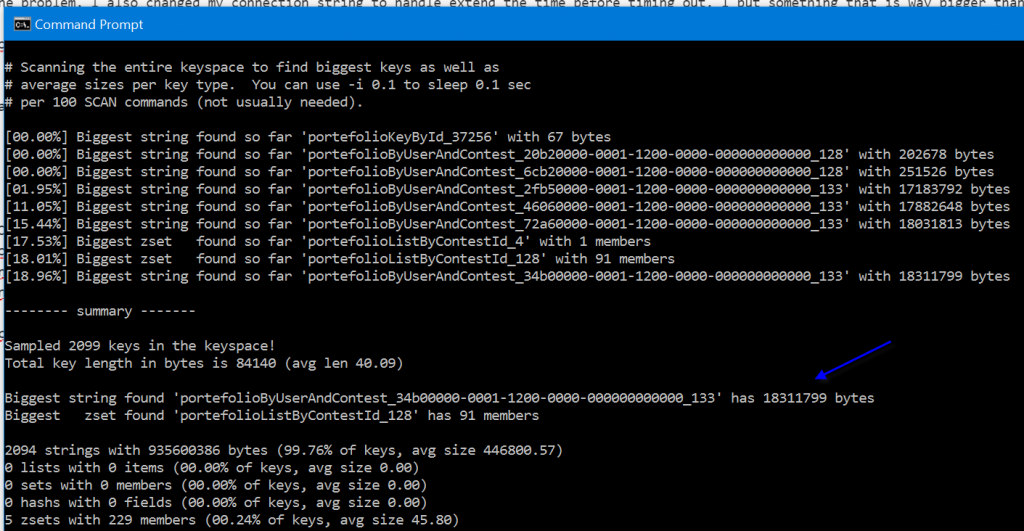
From there, I was able to do some optimization and reduce my biggest key to less than 1 meg.
At that point, I though I was in a better situation. But few hours later the problem was still there. I noticed a lot of log with the Redis exception. I finally found that since I am using Azure slot that webjobs are executed on the real website as well as the staging slot. That means that I had twice as traffics coming from the webjobs. Instead of about 18 jobs, I had 36 jobs doing everything twice at the same time, hence creating a lot of traffic on Redis. To have you Website Slot not executing webjobs you need to have a slot setting in the portal. It's "webjobs_stopped" with the value 1. Be sure you mark this setting as a slot setting, this way it won't get transferred when you switch from staging to production.

I was still intrigued to see that on the Azure Portal, under Azure Redis that after few hours, the size was reaching the limit of 1 gig. In dev, nothing went more than 100 megs. I ran again the bigkeys and saw some huge entry. The culprit was Entity Framework. With the time, users were adding a lot of data and some entities were referring each others. For example A->B->A[] and A also has reference to C, D, where D->A[] and so on. So the tree that was serialized was huge when in reality the objects tree wasn't that huge. With some modification, I was able to get back to around 150 megs. I was still getting error, and this is when I decided to capture with Application Insight all the size when I set value on Redis.
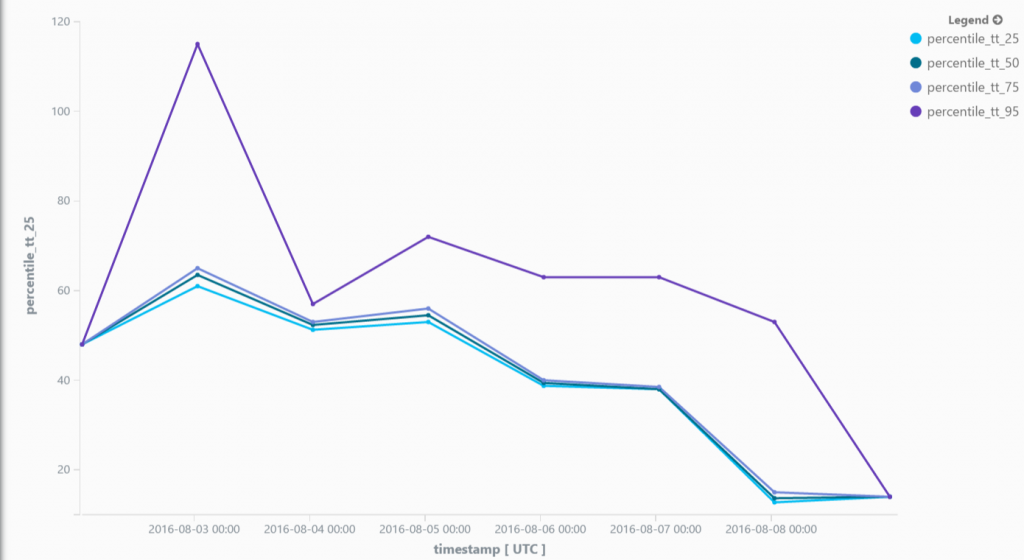
Here is a snapshot of few hours:
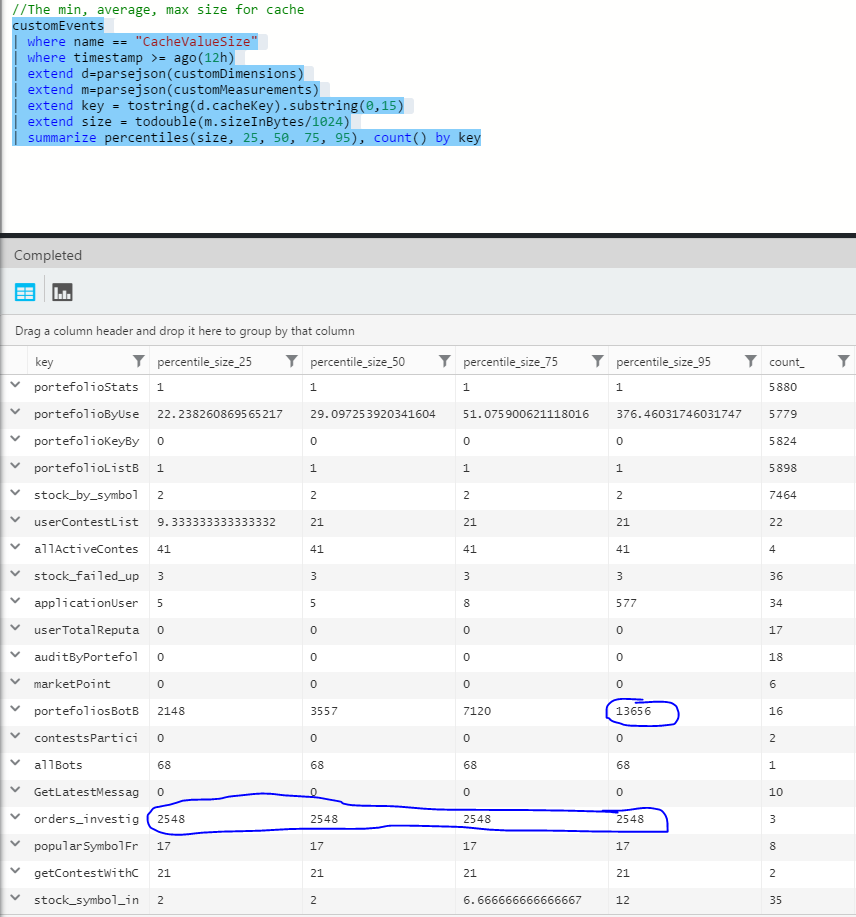
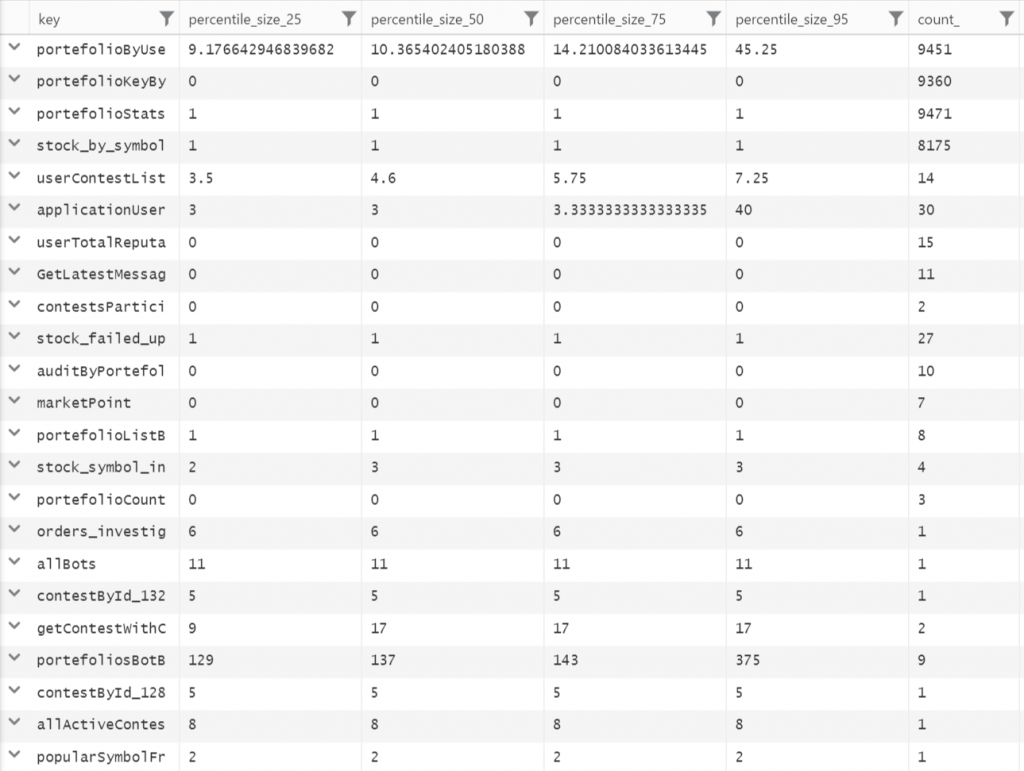
We can see the key prefix with the percentile and the count. 2 of them looks to be problematic even if they are in low volume (16 and 3). It still odd that with 50 threads and multiple pool that these can be problematic, but it was a good indication that some keys were hosting too much value. To fix this problem, two actions was successful. The first one was to serialize with a max depth. I'll write a future article about how to modify Json.Net to serialize a limited amount of deepness. This is critical if you are using Entity Framework because reference can be very deep. The second solution was to compress the data sent to Azure Redis. I'll also write a future article on how this can be implemented. In short, I am compressing every objects sent to Redis using LZ4 encoding. I am getting a very fast compression that cut around 75% of the size. Here is the result in kilo-bytes of the same data with theses 2 changes. The result is stunning. A lot of information is less than 1ko and most of the data is under the suggested limit of 100ko per key.
The next step was to see the number of get and set. In some webjobs, the amount was very high for small value and those values were used in the same webjob. So, to get around 500 values from the cache, about 10 000 calls were made. The problem was that with that many calls, even if it was small call, with the latency of doing this call from the webserver to the cache server, the time was increasing. A change in the code to improve was to use MGET of Redis to get few values from multiple key with a single call, as well as storing the values into a memory cache for a quick amount of time (I choose 5 minutes) and a small amount of memory (I choose 100 megs). So, the architecture stayed to be Controller -> Service Layer -> Accessor Layer -> Repository Layer but instead of having in Access Layer just the logic to handle Redis, this one is also using System.Runtime.Caching.MemoryCache. The first round to get the data from Redis still take some time but after it's blazing fast.
I was still having some jobs taking more time that I wanted. More a job takes time, more it has chance to access data on the cache. I added a lot of log and realized that my serialization was still taking some time before accessing Redis. Two solutions was possible. One is to serialized less deep and the other one is to do some parallel operation when setting. To have less serialization deepness you need to trick Json.Net (I am using Json.Net). This can be done with a ContractResolver that count the number of level the serialization goes. This is crucial if you are using Microsoft Entity Framework because references go very deep with object. I found a sweet spot at 5 level deep. The performance improved by 70% in average. The parallel was quick to do, but has a drawback of using the same thread as the web, hence it impacts more the front-end. Microsoft recommends to have your heavy webjob on another web instance. For the moment, I did not. The result is :
 Task.Factory.StartNew(() => {
  // Serialization occur here + set to Redis
} , CancellationToken.None , TaskCreationOptions.DenyChildAttach , TaskScheduler.Default);
It's fire and forget. We store and continue. One of my biggest job who was taking 12 minutes went down to 4 minutes. 3x faster! This particular part takes about 2 minutes to run all, which is not that bad. The second drawback is the possibility to bring back some Redis timeout since we do a lot of call to Redis. The third drawback, which made me rollback that change is the one mentioned right before the code snippet : the web was getting slow. All threads were taken by this job leaving nothing for web request. I put the idea on ice, I think with a restrained pool of thread that we can have something interesting here.
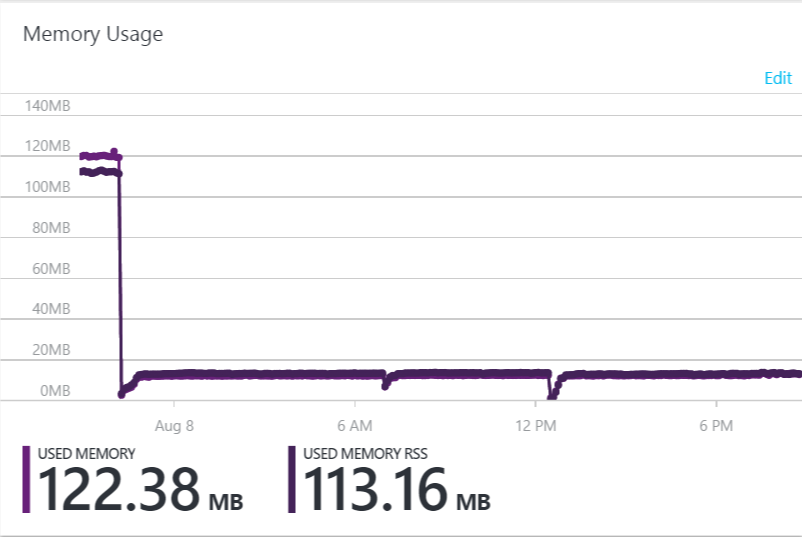
With all the current modification, I saw some major improvement in term of Redis timeout. Compression was a key element to reduce the overall load as well as reducing the size of each serialized element. In fact, I went from 160megs to 1 gig to 120megs to 16 megs.
Most Azure web jobs performance improved significantly. Here is an example of a task that went from around 50 minutes to a stable 13 minutes. Even if the performance is far from being at the target, the reduction is noticeable and are now under the trigger threshold of 20 minutes which is a first step in the right direction.
What next? The idea of working with thread/asynchonous set is really appealing since setting into the cache is not something we should be needed to wait for. Limiting the amount of item to cache is also an avenue possible as well as having a faster serialization process.