
The breakpoint will not currently be hit. No symbols have been loaded for this document
Posted on: 2011-12-03
Some time Visual Studio can be not a pleasure. You may sometime arrive at a point where you compile and your new code doesn't seem to load so you decide to add a breakpoint for debugging. But, unfortunately you have a red dot in Visual Studio that is not completely fill up. When you put your mouse cursor hover it you can read the following message :
The breakpoint will not currently be hit. No symbols have been loaded for this document
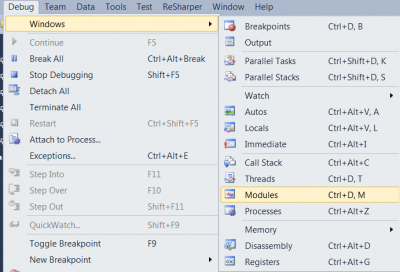
From there, you can go and confirm that the debug file, the PDB, is not loaded. You can see that in the Symbol Status column of the Module window. The Module window is available only when debugging under Debug>Window>Module.
If you right click you will be allowed to load symbol from file. If you can go in the Debug folder and select the file do it. If you receive a message saying that the file cannot be loaded than more step is required.
The next step is this one:
- Close Visual Studio
- Kill all process of webdev
- Delete the Bin and Obj folder of your library that doesn't load
- Open Visual Studio and compile
You may want to close IIS (net stop w3svc) before doing all those commands if you are using Asp.Net. To restart IIS simply use net start w3svc. You can also do it with the UI with IIS manager tool. From there, you should be able hook the PDB file (if it's not done automatically) and debug.
Edit
You may also try to :
- Reboot
- Delete
C:\\Windows\\Microsoft.NET\\Framework\\v4.0.30319\\Temporary ASP.NET Files\\ - Delete
C:\\yourPathTo\\bin - Delete
C:\\yourPathTo\\obj - Change AnyCPU to X86
- Build
- Start Debugging