
Using Intellitrace to help debugging your .Net
Posted on: 2014-01-14
IntelliTrace is available since Visual Studio 2010 and it's available on the Ultimate. This may be the reason why it's not very popular since a lot of developer doesn't have the ultimate version. Nevertheless, it's a powerful debugging tool and it has been improved slightly with the 2012 and 2013 version of Visual Studio. In short, IntelliTrace is an enhancement of the traditional breakpoint debugging but not a replacement.
IntelliTrace allows you to have snapshot of step in the time. This mean that if you hit a break point or you have an exception that break the code, IntelliTrace can show you the stack with different value that has been set. The traditional debugging allows you to modify values of variable, IntelliTrace does not. They have both different goal.
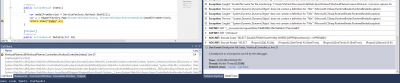
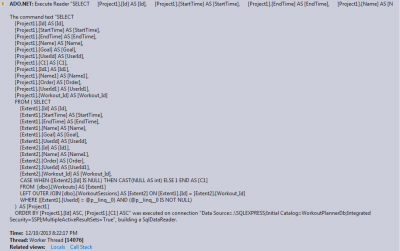
The screenshot above shows some information you can get with a simple call to a controller. As you can see, we have information about the MVC routing and also about what SQL Query has been sent to the database. This allow you to not have to use a SQL profiler to know what is sent to the database.
If you double click the line an entry in the Intellitrace, you see the whole detail but also the code window is going to the line where the data has been gathered. In the example above, the code selected is the line that call the repository:
public IEnumerable<Workout> GetAll() { var listModel = Repository.Workout.GetAll().ToList(); return listModel; }
To enable the IntelliTrace or to change some option, go in the Tools>Options>Intellitrace.
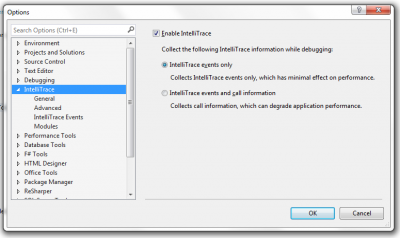
The default allows IntelliTrace to work with event. This mean that IntelliTrace has been injected in the code and records event like SQL query, http errors, exceptions, etc. It's possible to collect more information. To enable additional collect of information, in the option select events and call. This will slow down your debugging sessions because it injects additional code inside your code to collect information. However, richer information is recorded.
- Function name
- Values of primitive data types passed as parameters and returned value for every methods
- Values of properties when they are read or changed
Call is reachable by filtering at the top of the IntelliTrace window and also from event. At the button of the event, a link "Calls" is available. If you click on it, the list of calls will be displayed. It looks a lot like the normal debugging .