Using Service Trace Viewer Tool to debug WCF service
Posted on: 2013-06-10
Microsoft provides a free tool to test your WCF service. This tool let you see a lot of thing that you can define at which level you want to see.
The first step to configure the tool is to go inside your service project and open the configuration file.
You should add into the Configuration tag the code below:
<system.diagnostics> <trace autoflush="true" /> <sources> <source name="System.ServiceModel" switchValue="Information, ActivityTracing" propagateActivity="true"> <listeners> <add name="sdt" type="System.Diagnostics.XmlWriterTraceListener" initializeData= "yourFileName.log" /> </listeners> </source> </sources> </system.diagnostics>
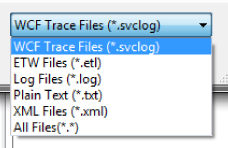
Your file can contain any extension. The tools be default will search for few ones but you can at the end select All and see every extensions.

You can also specify to log only error instead of information. ActivityTracing will trace every activity which can be heavy on the log file.
To use this tool, open a developer console and type : SvcTracerViewer.

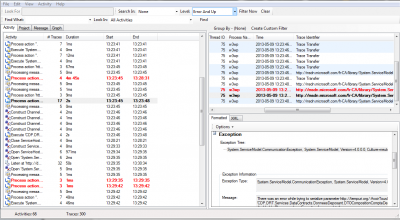
A windows application will start and will let you select your tracing file and apply several filters.

From here you should be able to get what's wrong with your WCF without having to attach any process to a remove WCF service.
